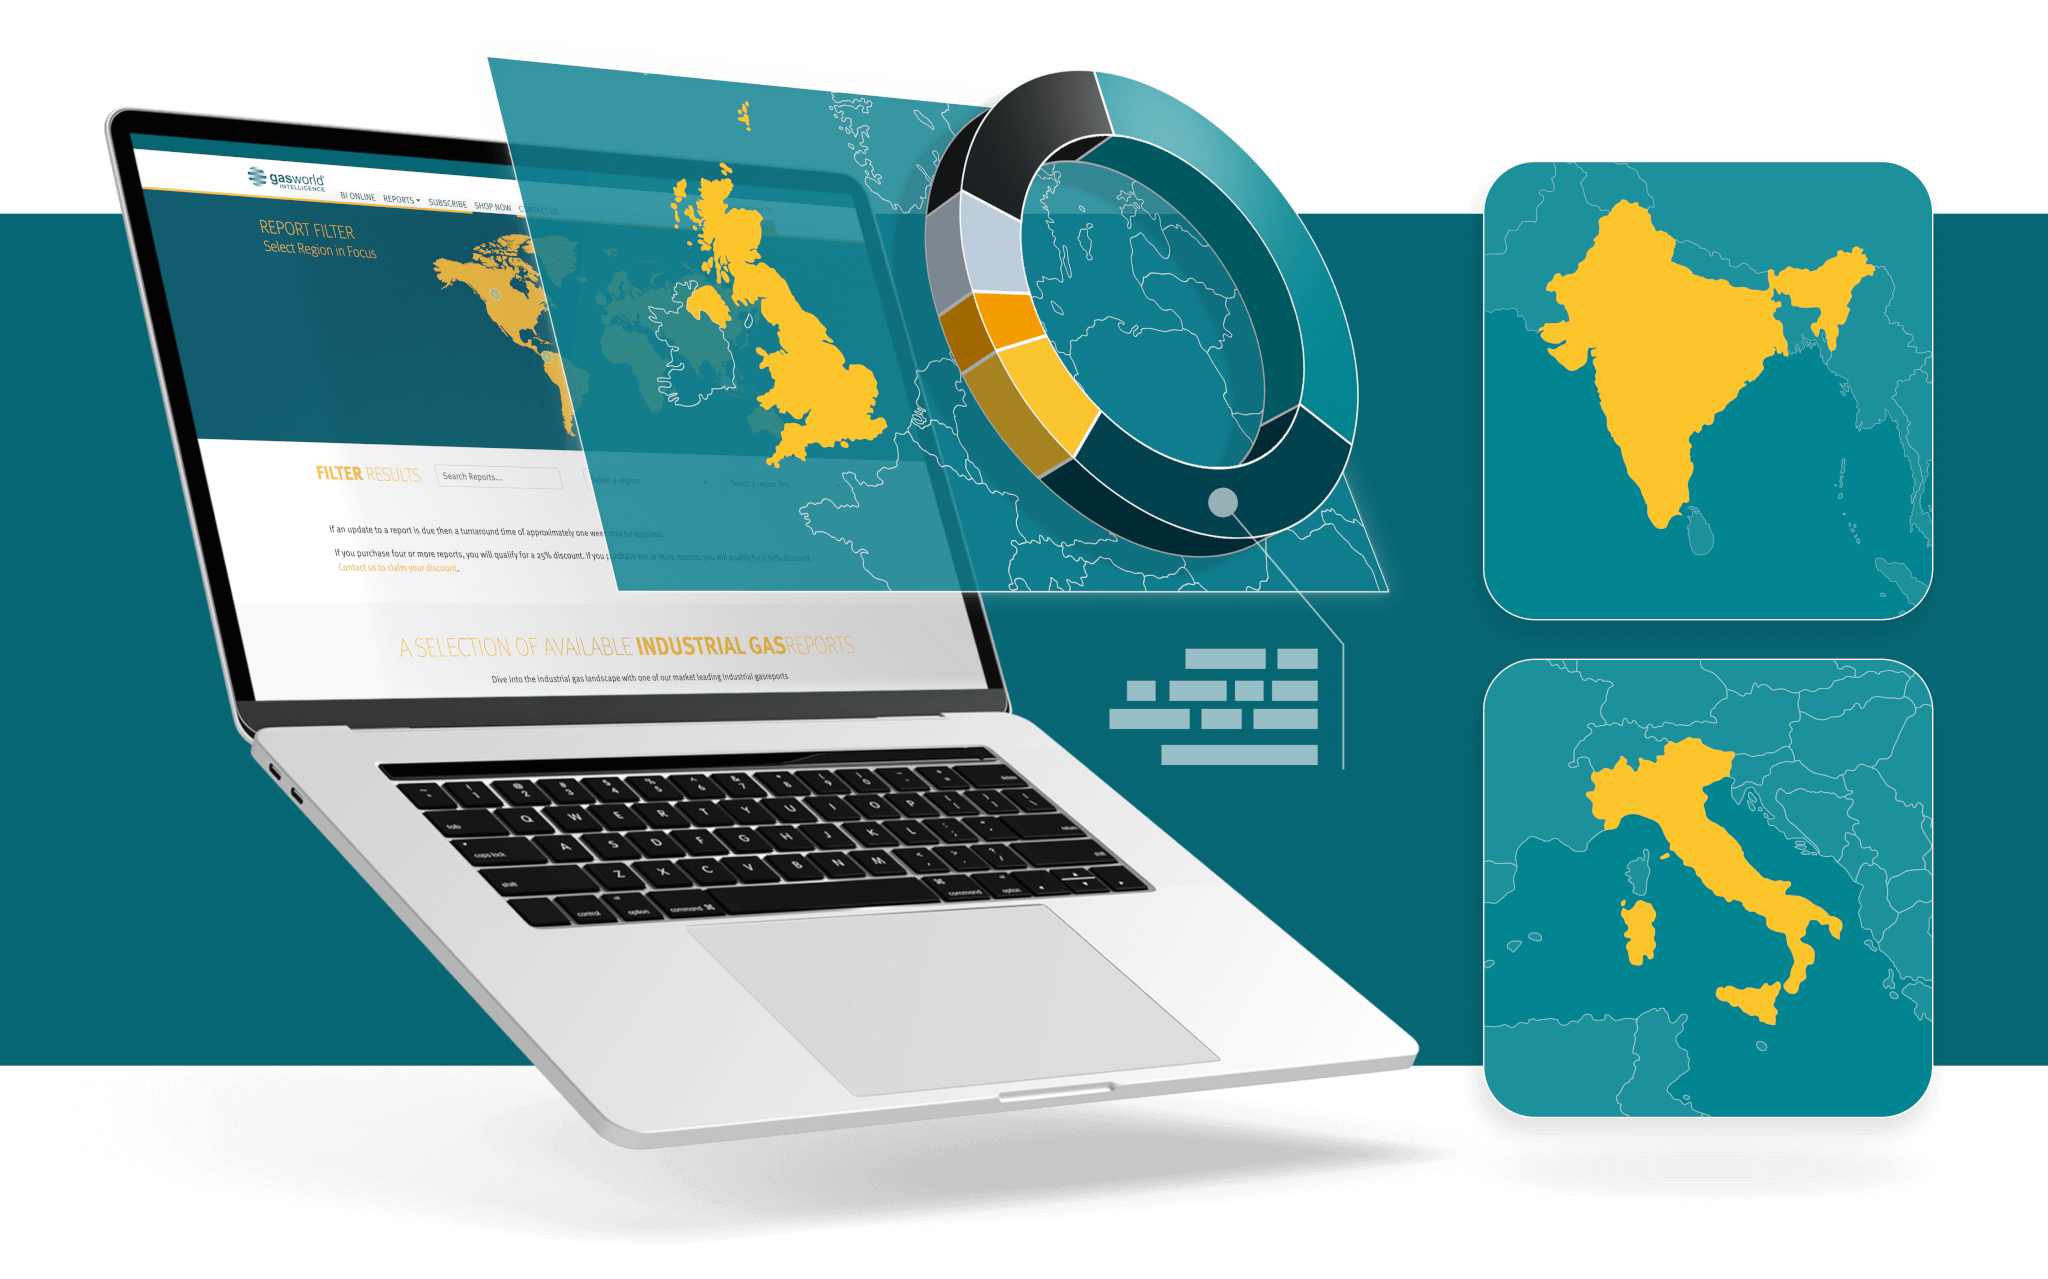
Gain instant clarity into market dynamics with interactive dashboards featuring market share split by gas company, supply mode, gas type, and end-user industries. Visualise production and distribution networks through interactive facility maps. Additionally, leverage 5-year market forecasts to make informed strategic decisions. This unparalleled level of detail allows you to analyse the market on a global or regional scale, pinpointing the most promising opportunities for your business. All data featured within each dashboard’s charts is available to download.


These dashboards provide an intuitive and dynamic interface where you can explore critical market data. You’ll find market share breakdowns by gas company, supply mode, gas type, and end-user industries. This interactivity allows you to quickly grasp market dynamics and identify trends.

The dashboards include interactive maps that visualise production. You can pinpoint specific facilities, understand their locations, and analyse their impact on the overall market. These maps enhance your understanding of the gas industry’s infrastructure.

Gain a competitive edge by leveraging detailed 5-year market forecasts. These projections empower you to make informed strategic decisions. Whether you’re thinking globally or regionally, these forecasts help you identify promising opportunities for your business.